What actually happens when a trial reads out
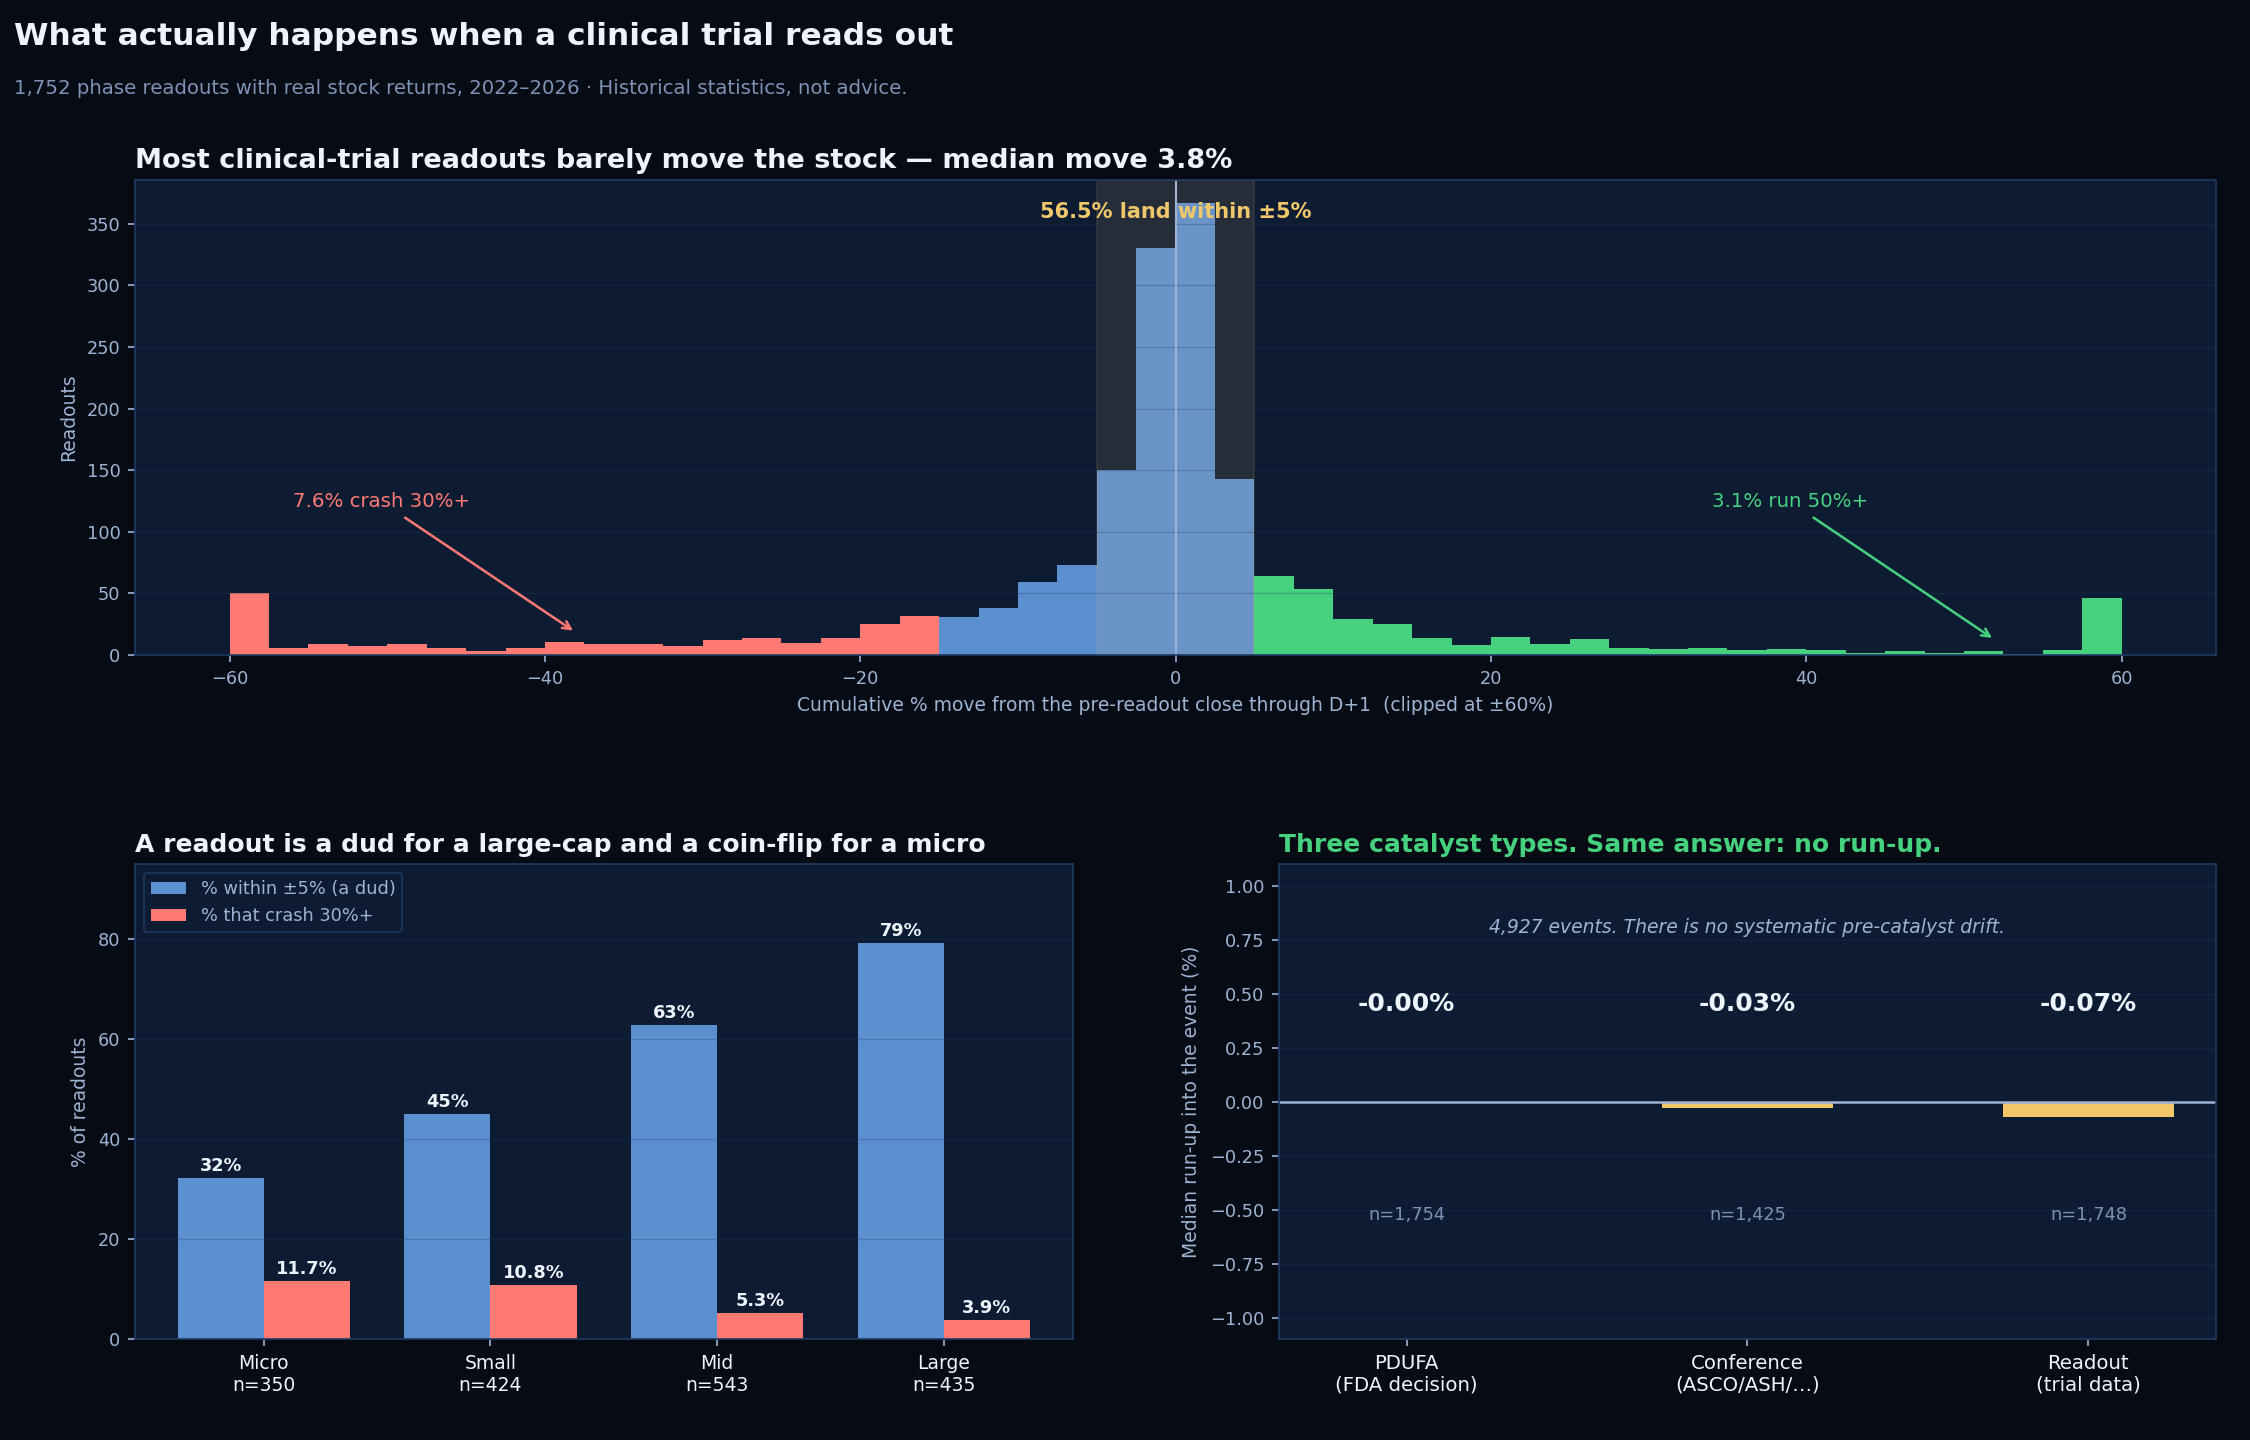
1. The distribution
| How far did the stock move? | Share of readouts |
|---|---|
| Within ±2%: a genuine non-event | 35.1% |
| Within ±5% | 56.5% |
| Within ±10% | 70.8% |
| Crashed 30% or more | 7.6% |
| Ran 50% or more | 3.1% |
A note on honesty. Our own internal tiering calls 68% of these readouts “FLAT”, and it would have been an easy, punchy stat to publish. We didn’t, because that bucket spans −14.9% to +5.0%; it is asymmetric, and a 14% decline is not “nothing.” The honest number is 56.5% within ±5%. If a statistic needs a generous bucket to sound impressive, it isn’t the statistic.
2. The same event is a non-event for a large-cap and a coin-flip for a micro
| Cap tier | n | Median |move| | Within ±5% (a dud) | Crashed 30%+ |
|---|---|---|---|---|
| Micro | 350 | 8.71% | 32% | 11.7% |
| Small | 424 | 6.16% | 45% | 10.8% |
| Mid | 543 | 2.99% | 63% | 5.3% |
| Large | 435 | 1.67% | 79% | 3.9% |
For a large-cap, 79% of readouts are duds and only 3.9% crash. For a micro-cap, just 32% are quiet and 11.7% crash 30%+: a 3× higher wipe-out rate. Same catalyst class, completely different risk.
3. Is there a run-up into a readout? No.
| Window | n | Median | 25th pct | 75th pct |
|---|---|---|---|---|
| D-30 → D-1 | 1748 | -0.07% | -7.69% | +8.64% |
| D-10 → D-1 | 1750 | +0.00% | -4.22% | +4.55% |
| D-5 → D-1 | 1751 | +0.23% | -2.12% | +2.84% |
| Catalyst | n | Median run-up (D-30 → D-1) |
|---|---|---|
| FDA decisions (PDUFA) | 1,661 | +0.43% |
| Conference presentations | 1,425 | −0.03% |
| Clinical trial readouts | 1,748 | −0.07% |
Over 4,834 events across three catalyst classes that share almost nothing, different regulators, different information, different timelines, and all three land within half a percent of zero. No systematic pre-catalyst run-up. The “buy the run-up” folklore that dominates biotech retail is not visible in the data. Individual names run; the population does not.
Corrected 2026-07-13. We previously printed the PDUFA cell as +0.57% (n=1,792). That figure was computed on a panel containing 202 duplicate rows. Deduplicated, it is +0.43% (n=1,661). The conference row was also rebuilt on a wider sampling frame we have since reverted (see the conference study corrections). Neither change alters the conclusion, all three classes still land within half a percent of zero, but we print what the data says, not what we said last week.
We could find no published study of pre-announcement drift for biotech catalysts: the event-study literature concentrates on announcement-day returns. We state that as a gap we could not fill by searching, not as a claim to be first.
Method
Universe. 1,752 clinical-trial readouts by US-listed biotechs, 2022-2026, matched to daily closing prices. Measure. The cumulative % move from the last close before the readout through the first trading day after; readouts are frequently released outside market hours, so a same-day-only measure would miss most of the reaction. Run-up. Trading-day windows to the last pre-readout close. Statistics. Median and interquartile range; we do not report a mean (a handful of 500%+ moves would dominate it) and we never report a “win rate.”
2. Selection. Our universe is readouts we track, weighted toward companies where the readout was material enough to disclose.
3. Dispersion, not prediction. Nothing here forecasts any individual trial. The distribution is wide, and the left tail is the part that ends companies.
“pdufa.bio, Biotech stock reaction to clinical trial readouts (2022-2026), n=1,752, https://www.pdufa.bio/research/readout-reaction”
Not affiliated with or endorsed by the FDA. pdufa.bio is an independent publication with no affiliation with, endorsement by, sponsorship by, or connection to the U.S. Food and Drug Administration or any other government agency. “FDA”, “PDUFA” and all company, drug and ticker names are used descriptively and remain the property of their respective owners.
Informational and educational purposes only. Not investment advice. Nothing on this page is investment, legal, tax or medical advice, or an offer or solicitation to buy or sell any security. pdufa.bio is not a registered investment adviser or broker-dealer and does not recommend trades or publish individual-drug approval probabilities. Verify every date and outcome against primary FDA, SEC or company filings. Data is provided as is, without warranty of any kind, and past behaviour does not predict future outcomes.
© 2026 pdufa.bio. All rights reserved.