Short interest into FDA decisions
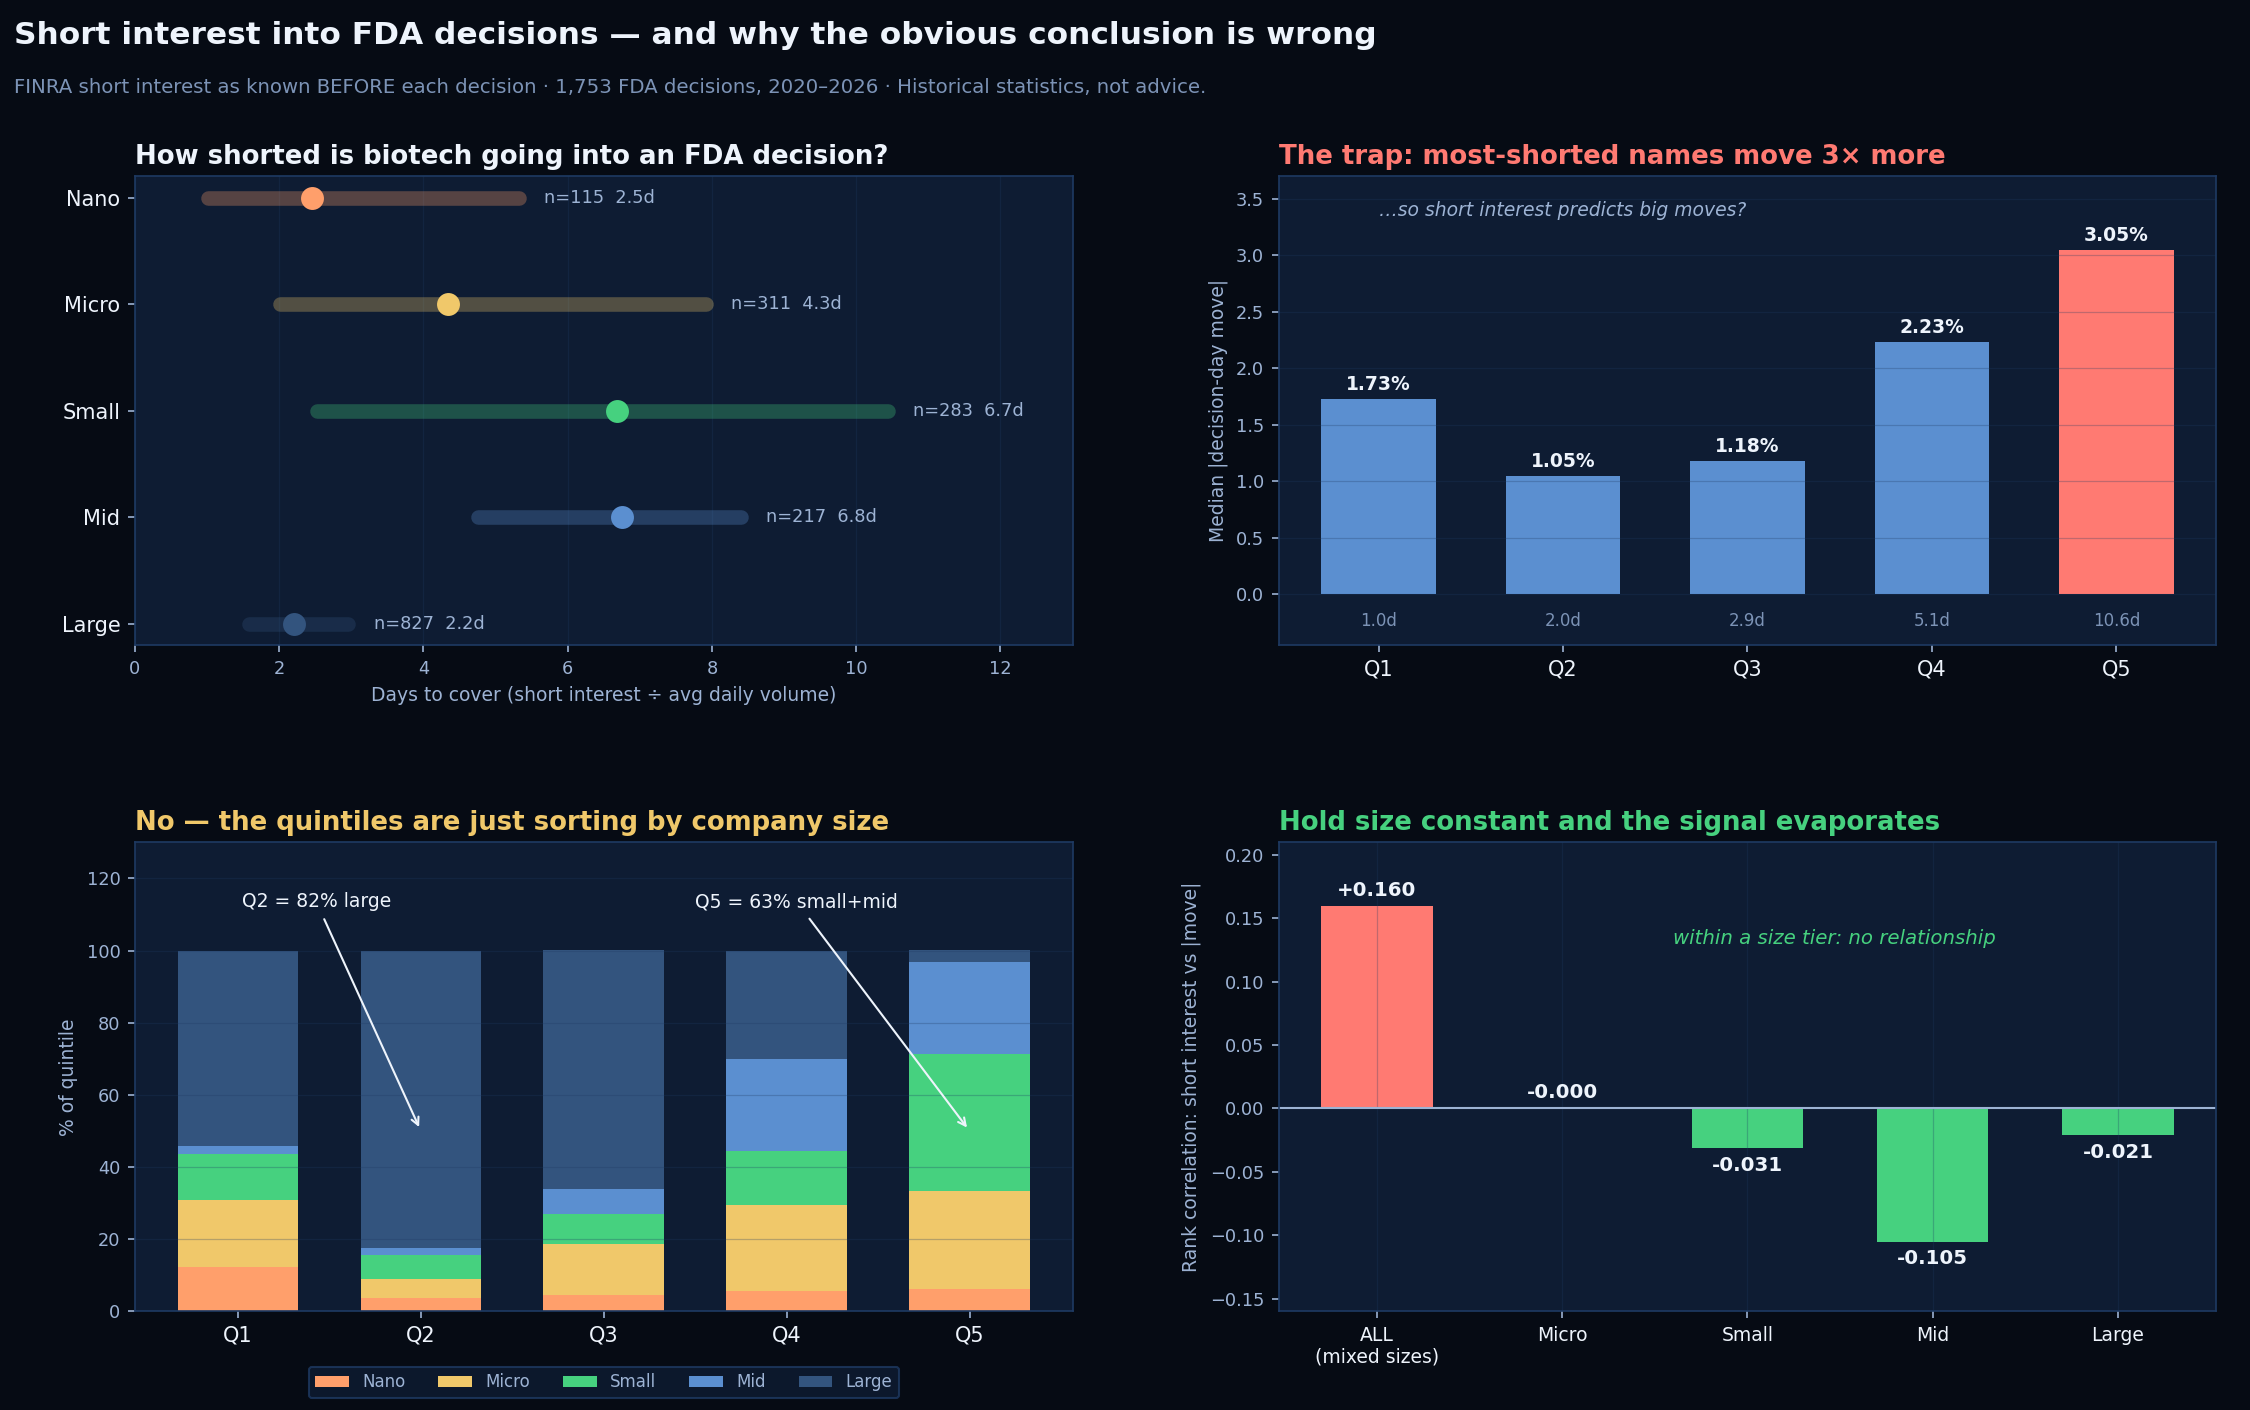
1. How shorted is biotech going into an FDA decision?
This is the part nobody publishes. Days to cover = short interest ÷ average daily volume: how many days of normal trading it would take shorts to buy back.
| Cap tier | n | Median days to cover | 25th pct | 75th pct |
|---|---|---|---|---|
| Nano | 115 | 2.5d | 1.0d | 5.3d |
| Micro | 311 | 4.3d | 2.0d | 7.9d |
| Small | 283 | 6.7d | 2.5d | 10.4d |
| Mid | 217 | 6.8d | 4.8d | 8.4d |
| Large | 827 | 2.2d | 1.6d | 3.0d |
Small- and mid-caps carry by far the heaviest short interest into an FDA decision (≈6.7 days): roughly 3× a large-cap. Nano-caps are counter-intuitively low at 2.5 days: they are hard and expensive to borrow, so shorts often simply can’t build a position.
2. The trap
Now bucket every decision into five groups by short interest, and look at how big the decision-day move was:
| Quintile | n | Median days to cover | Median |move| | % large-cap | % small+mid |
|---|---|---|---|---|---|
| Q1 | 356 | 1.0d | 1.73% | 54% | 15% |
| Q2 | 346 | 2.0d | 1.05% | 82% | 9% |
| Q3 | 350 | 2.9d | 1.18% | 66% | 15% |
| Q4 | 350 | 5.1d | 2.23% | 30% | 40% |
| Q5 | 351 | 10.6d | 3.05% | 3% | 63% |
Q5 moves 3.05% versus 1.05% for Q2. Across all 1,753 events the rank correlation is +0.160. A tempting headline, “heavily shorted biotechs move 3× more into FDA decisions”: is sitting right there.
3. Why it’s wrong
Look at the last two columns of that table. The quintiles aren’t sorting by short interest: they’re sorting by size. Small- and mid-caps are both more shorted and naturally more volatile. So we ran the only test that matters: hold company size constant.
| Within cap tier | Correlation: short interest vs |move| |
|---|---|
| All events (mixed sizes) | +0.160 |
| Micro | -0.000 |
| Small | -0.031 |
| Mid | -0.105 |
| Large | -0.021 |
Inside a single size tier, short interest tells you nothing about how big the move will be; the correlation is zero, and if anything slightly negative. The apparent signal was a Simpson’s paradox: a real pattern in the pooled data that reverses or disappears once you condition on the confounder.
Method
Data. FINRA bi-monthly short-interest filings, matched to each FDA decision by ticker. Point-in-time. For every event we use only the short-interest reading already published before that decision (median lag 9 days, 95th percentile 15), no lookahead. Measure. Days to cover = short interest ÷ average daily volume. Move. The absolute decision-day reaction; we deliberately do not report direction. Reporting which way heavily-shorted stocks went would be an approval-odds claim in disguise, and we don’t do those. Statistics. Median, interquartile range, and Spearman rank correlation. Rows with stale short interest (>45 days old) or implausible days-to-cover (>60) were excluded.
2. Days to cover embeds volume. It is a ratio, so a volume spike shrinks it without a single share being covered.
3. Absence of evidence. We found no within-tier relationship. That is not proof none exists, only that, at this sample size and with this measure, there isn’t one worth acting on.
“pdufa.bio, Short interest into FDA decisions (2020-2026), n=1,753, https://www.pdufa.bio/research/short-interest-fda”
Not affiliated with or endorsed by the FDA or FINRA. pdufa.bio is an independent publication with no affiliation with, endorsement by, sponsorship by, or connection to the U.S. Food and Drug Administration or any other government agency. “FDA”, “PDUFA” and all company, drug and ticker names are used descriptively and remain the property of their respective owners.
Informational and educational purposes only. Not investment advice. Nothing on this page is investment, legal, tax or medical advice, or an offer or solicitation to buy or sell any security. pdufa.bio is not a registered investment adviser or broker-dealer and does not recommend trades or publish individual-drug approval probabilities. Verify every date and outcome against primary FDA, SEC or company filings. Data is provided as is, without warranty of any kind, and past behaviour does not predict future outcomes.
© 2026 pdufa.bio. All rights reserved.